Key Points
- Ethereum price rallied above the $150 resistance before sellers appeared near $160 against the US Dollar.
- ETH declined sharply towards a major bullish trend line with support at $118 on the 4-hours chart (data feed from Coinbase).
- The price is likely to find a strong support near the $118 and $120 levels in the near term.
Ethereum price rally found a solid barrier near the $159-160 zone against the US Dollar. ETH corrected lower sharply, but it could find support near $120.
Ethereum Price Analysis
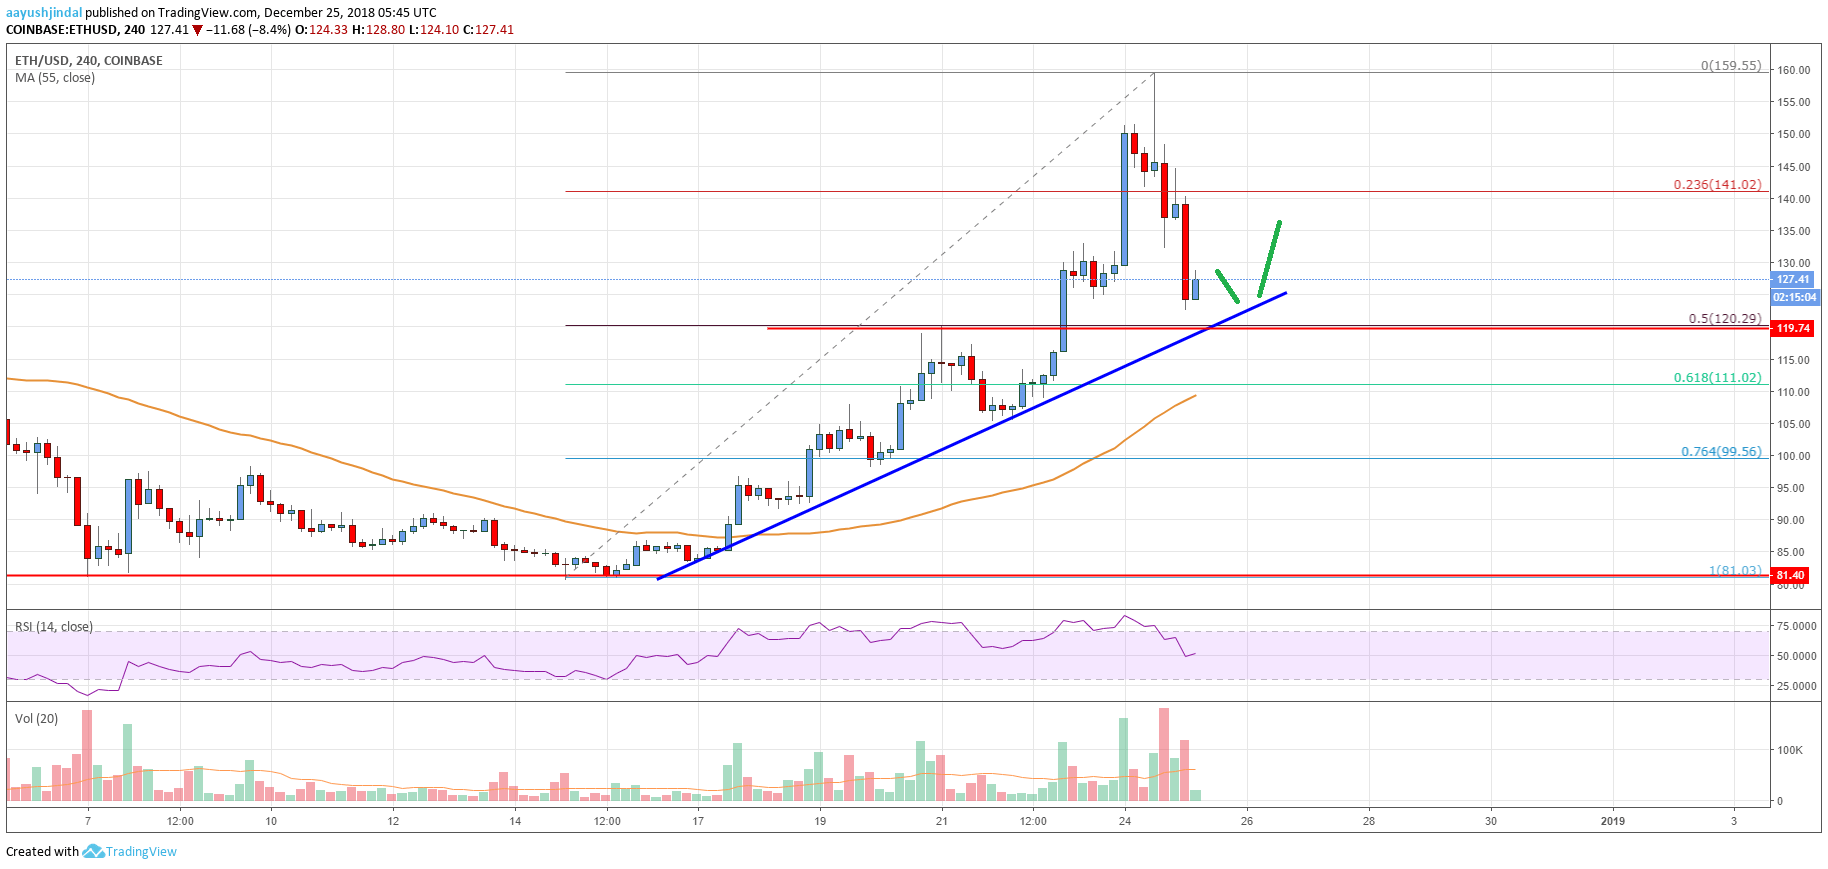
This past week, we discussed the chances of more gains above $100 and $110 in Ethereum price against the US Dollar. The ETH/USD pair gained traction and broke the $120 and $135 resistance levels. There was also a close above the $135 level and the 55 simple moving average (4-hours). The price even broke the $150 resistance and traded as high as $159.55.
Later, there was a sharp downside correction and the price declined below $144, $140 and $138. There was also a break below the 23.6% Fib retracement level of the last wave from the $81 low to $159 swing high. However, the price is now approaching a major support area near $120. There is also a key bullish trend line formed with support at $118 on the 4-hours chart. Besides, the 50% Fib retracement level of the last wave from the $81 low to $159 swing high is also near $120. Therefore, the $118 and $120 support levels are likely to act as strong buy zones in the near term.

Looking at the chart, Ethereum price could bounce back after testing the $120 support. On the upside, it must clear the $135 and $140 resistance levels to start a new upward move. The next resistance is at $144 and $150.
Looking at the technical indicators:
4-hours MACD – The MACD for ETH/USD is slightly in the bearish zone.
4-hours RSI (Relative Strength Index) – The RSI is just near the 50 level.
Key Support Level – $120
Key Resistance Level – $135


