Key Points
- Ethereum price finally recovered after forming a base near $81 against the US Dollar.
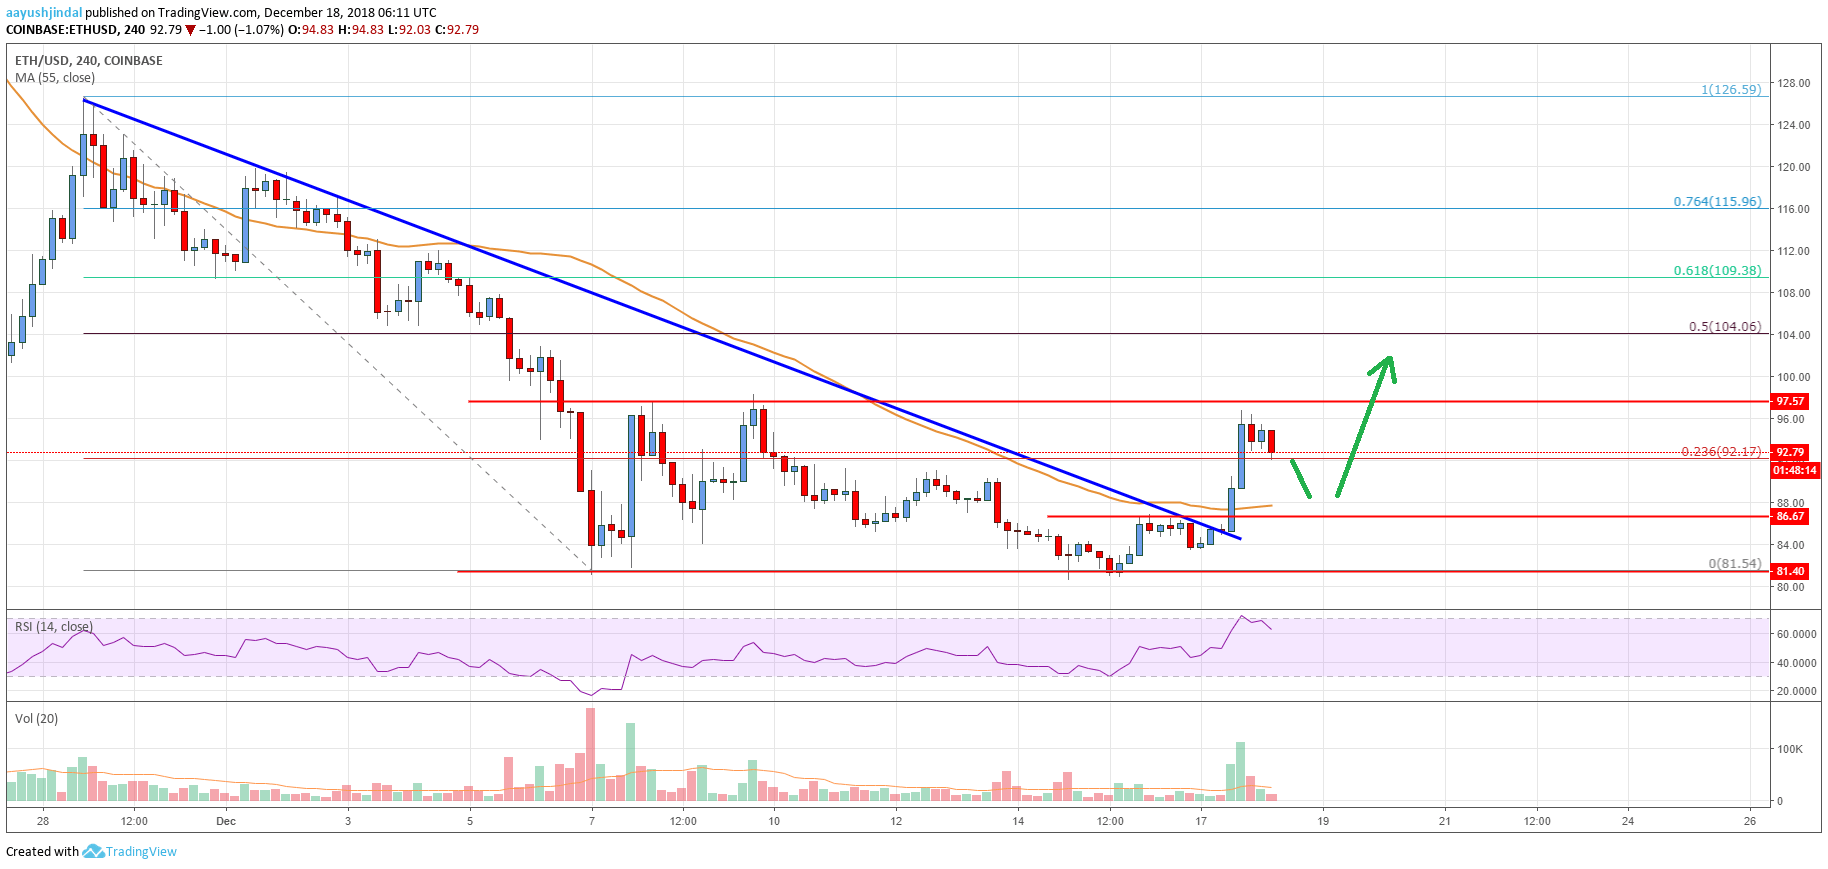
- ETH broke a significant bearish trend line with resistance near $86 on the 4-hours chart (data feed from Coinbase).
- The price must break the $97 and $100 resistance levels to stage a solid comeback in the near term.
Ethereum price gained traction above $86 and $90 against the US Dollar. ETH could turn super bullish if there is a close above $97 and $100.
Ethereum Price Analysis
After forming a crucial support near the $81 level, Ethereum price started an upward move against the US Dollar. The ETH/USD pair rallied recently and broke the $85, $86 and $90 resistance levels. More importantly, there was a close above $85 and the 55 simple moving average (4-hours). Besides, there was a break above the 23.6% Fib retracement level of the last drop from the $126 high to $82 swing low.
Buyers also cleared a significant bearish trend line with resistance near $86 on the 4-hours chart of ETH/USD. The pair traded above the $95 level and almost tested the crucial $97-98 resistance zone. The price is currently consolidating below $97 and it could correct a few points lower. An initial support is at $90, below which the price may test the $89 zone and the 55 SMA. The $87 level could also act as a solid support since it was a resistance earlier. On the upside, buyers must break the $97 and $100 resistances for further gains. The next stop may be the 50% Fib retracement level of the last drop from the $126 high to $82 swing low at $104.

Looking at the chart, Ethereum price is trading with a positive angle above $90. However, ETH must break the $97 and $100 resistance levels. If not, it could drop back to $87 or $82.
Looking at the technical indicators:
4-hours MACD – The MACD for ETH/USD moved into the bullish zone.
4-hours RSI (Relative Strength Index) – The RSI is just above the 60 level.
Key Support Level – $87
Key Resistance Level – $97


