IOTA continues to trend higher against bitcoin as it previously bounced off the bottom of its ascending channel on the 1-hour chart. Price has also broken past the mid-channel area of interest but is in the middle of a pullback before heading up to the resistance around 0.00030.
The 100 SMA is above the longer-term 200 SMA on the 1-hour time frame to indicate that the path of least resistance is to the upside. This suggests that the uptrend is more likely to continue than to reverse. However, the gap between the moving averages has narrowed to signal weakening bullish momentum.
Stochastic is also on the move down to indicate that sellers have the upper hand. RSI has more room to fall, so a deeper correction may be in order. In that case, IOTA could revisit the channel support around 0.000024 before bouncing again.

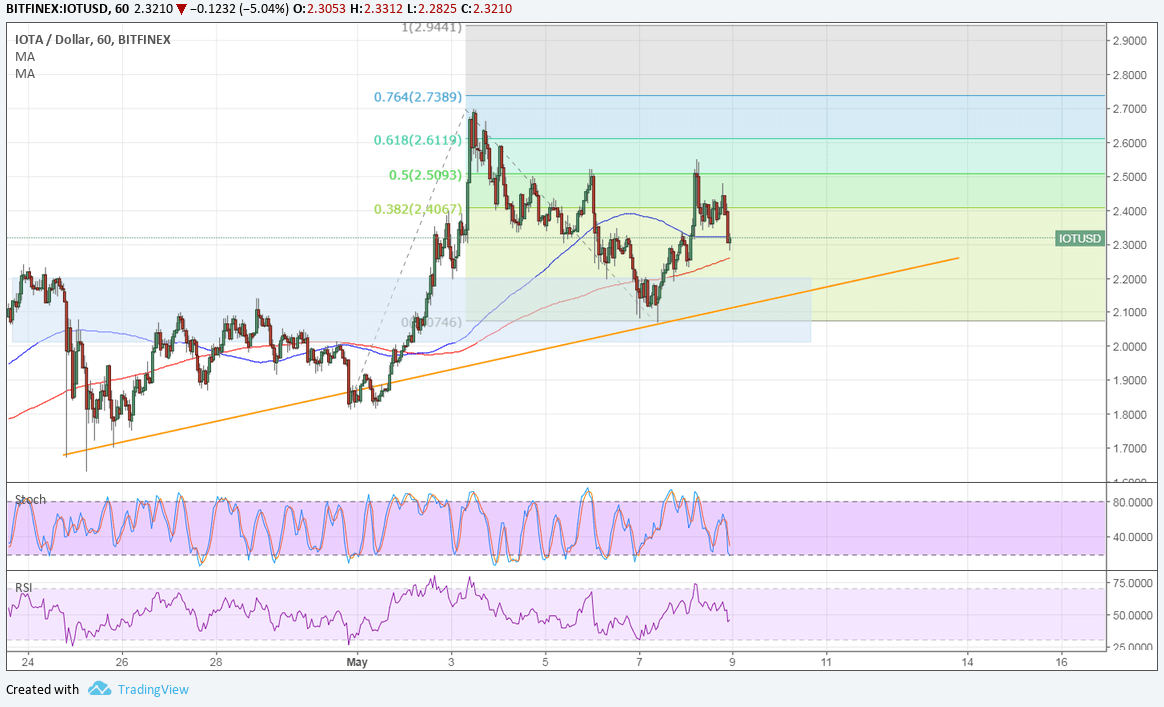
Against the dollar, IOTA appears to have completed its pullback and is on its way up to test the next resistance levels shown by the Fib extension tool.

Price has already bounced off the 50% extension at 2.5093 and might be due for another test of the area of interest at the rising trend line. If the climb continues, IOTA could still test the 61.8% extension at 2.6119 or the 76.4% extension at 2.7389. The full extension is located at 2.9441.
The 100 SMA is above the longer-term 200 SMA on this chart to indicate that the path of least resistance is to the upside. IOTA appears to be finding support at the 100 SMA dynamic inflection point also. However, the gap between the moving averages is also narrowing to reflect weakening bullish momentum.
Stochastic is on the move down but is nearing oversold levels to show that sellers are exhausted and buyers could take over from here. RSI has more room to fall so a deeper pullback could be underway. A break below the swing low and trend line could lead to a downtrend for IOTA versus the dollar, especially as geopolitical risk is back in play.


