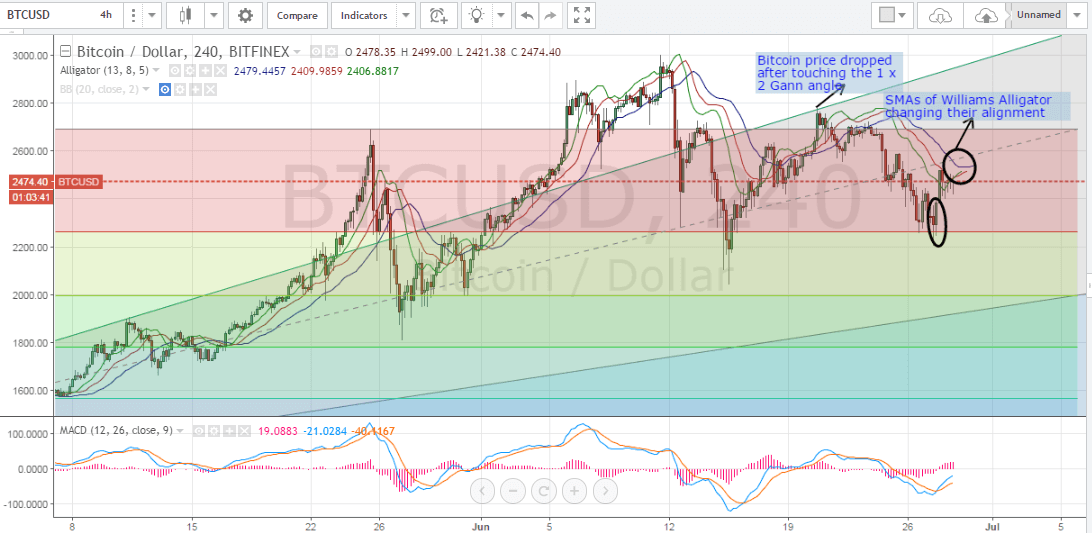
After scoring a high of $2,775, bitcoin price dropped during last week’s trading sessions to record a low of $2,203 yesterday, before rising again to $2,475 at the time of writing of this analysis. The last wave of the 5 Elliott wave formation we spotted on the 4 hour BTCUSD chart during last week’s analysis hasn’t been formed. However, the 23.6% Fibonacci retracement ($2,262.62) proved that it represents a strong support level that prevented further price drop.
So, where will bitcoin price be heading during the upcoming week?
Note: Kindly refer to our earlier weekly analysis to get familiar with our Fibonacci retracement and Gann Angle placements.
Downtrend Reversed on the 4 Hour BTCUSD Chart:
By examining the 4 hour BTCUSD chart from Bitfinex, while executing the Williams Alligator and MACD indicator (look at the below chart), we can note the following:

- Bitcoin price surged to $2,775 and candlesticks started forming tangentially to the 1 x 2 Gann Angle on the 20th of June, as shown on the above chart. Market instability at the level of the 1 x 2 Gann led to reversal of the uptrend pushing bitcoin price all the way down to record a low of $2,203 yesterday.
- The downtrend was reversed when bitcoin price approached the $2,262 level which coincides with the 23.6% Fibonacci retracement. This level is continuing to prove that it is strong enough to prevent further price drop, especially that it resisted to be broken through when tested on the 15th of June. The relatively long downwards shadows of the 2 candlesticks forming near this level also indicate the strength of support at this price level.
- Right after the 23.6% Fibonacci retracement level was tested, a “bullish engulfing” pattern was formed as shown by the highlighted candlesticks on the above chart. This can be a reliable sign signaling reversal of the downtrend that has been controlling the market over the past week or so.
- The SMAs of the Williams Alligator have just started to change their alignment and a bullish signal will most likely be formed shortly with the red SMA above the blue SMA and the green SMA above both. I recommend refraining from investing in new long positions until a bullish signal can be obtained from Williams Alligator.
- The MACD indicator is still in the negative territory, yet the positive blue trend line has just crossed above the negative red trend line, and both curves are exhibiting an upward slope. A positive MACD value could confirm an upcoming uptrend.
- If bitcoin price manages to break through the $2,691 price level which represents the 0% Fib retracement, we can see it rise towards $3,000, yet this would most likely occur while candlesticks are formed below the 1 X 2 Gann angle i.e. it might take 7 to 10 days to reach this level.
Conclusion:
Bitcoin price dropped last week to record a low of $2,203, yet the downtrend has been reversed and price started rising to reach $2,475 at the time of writing of this update. Our technical analysis predicts bitcoin price to rise to test the resistance around the $2,691 price level within the next few days.
Charts from Bitfinex, hosted on Tradingview.com


