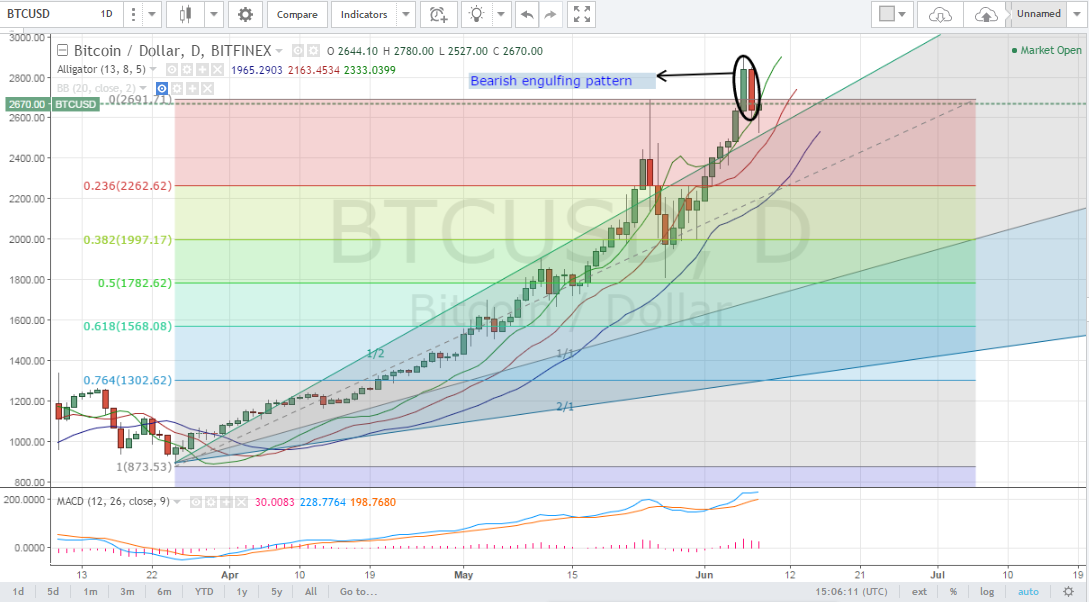
Bitcoin price continued skyrocketing last week, as we expected during our previous weekly analysis, to record a high of around $2,905 on Bitfinex last Tuesday. Bitcoin price has been rising, leading to the formation of 7 successive bullish candlesticks, on the 1 day BTCUSD chart, and recording successive higher highs each day, before a bearish candlestick was formed, corresponding to yesterday’s trading session.
Bearish Engulfing Pattern on the 1 Day BTCUSD Chart:
Let’s examine the 1 day BTCUSD chart from Bitfinex, while keeping the Fibonacci retracement levels and Gann angle placements we plotted during our previous analysis and executing the Williams Alligator and MACD indicators. We can notice the following:
- Bitcoin price has been rising last week recording successive higher highs every day, until a historical high of $2,905 was recorded last Tuesday, after which price started dropping. As shown on the below chart, the bullish momentum was slowed down when the 0% Fib retracement level around $2,691 was tested. This level seems to be resisting further advancement .
- A “bearish engulfing” pattern was formed by the candlesticks corresponding to Tuesday’s and Wednesday’s trading sessions (look at the two candlesticks highlighted by an ellipse on the below chart). This pattern signals reversal of the bullish trend that has been in action since May 27th. So, we will most probably see bitcoin price decline during the upcoming week. Moreover, bitcoin price is now moving above the 1 x 2 Gann angle, as shown on the below chart, which reflects market instability at the current price level, so we are likely to see price drop to lower levels to move nearer to the 1 x 1 Gann angle, where the market would be more stable.
- The Williams Alligator and MACD indicators are still exhibiting bullish signals. The bearish momentum is likely to increase when these indicators signals are reversed.

Downwards Price Correction In Action On the 4 Hour BTCUSD Chart:
Let’s examine the 4 hour BTCUSD chart from Bitfinex, while keeping our Fib retracements and plotting the Bollinger Bands indicator (look at the below chart). We can conclude the following:
- Bitcoin price has been rising since May 27th, until the uptrend was reversed on Tuesday. The downtrend can pull price down to around $2,262.62 which corresponds to the 23.6% Fib retracement level. No significant support can prevent price drop at higher levels. This is almost the same scenario that occurred during second half of May, when price surged and the uptrend was followed by a downwards price correction attempt that pulled price down near the 50% Fib retracement level around $1,782.62
- The uptrend was reversed when candlesticks started touching the upper Bollinger band. As price started dropping, candlesticks started forming near the middle Bollinger band, where the market is much more stable.

Conclusion:
Bitcoin price surged last week to record a new historical high of $2,905, before the uptrend was reversed starting a downwards price correction attempt. As per our technical analysis, we can expect bitcoin price to drop down to around $2,262.62 which corresponds to the 23.6% Fib retracement level during the upcoming week.
Charts from Bitfinex, hosted on Tradingview.com


