It seems that the birth of Bitcoin Cash has been a catalyst that helped push the price of bitcoin, or bitcoin proper, to the moon, as it surged from around $2,600 in the beginning of the week to record an all time high of $3,270 at the time of writing of this article. As bitcoin price has just hit an all time historical high, chances are big that we can see it head North to even much higher levels. However, note that volatility is extremely high at the moment, and even though the market is bullish, a price correction attempt will emerge sooner or later, as speculators and traders collect their profits.
Powerful Bullish Rally on the 4 Hour BTCUSD Chart:
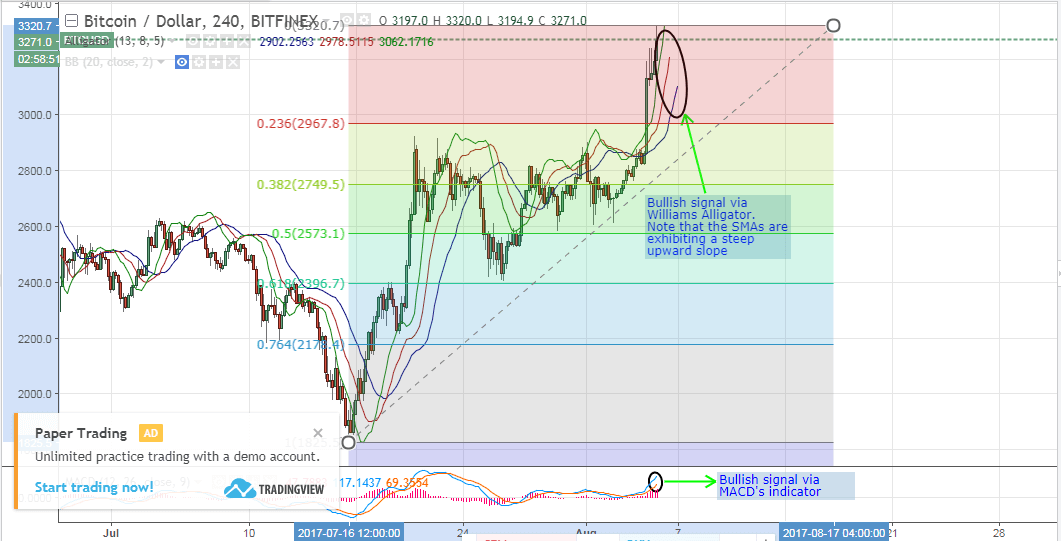
Let’s examine the 4 hour BTCUSD chart from Bitfinex, while plotting the Williams Alligator and MACD indicators (look at the below chart). We can note the following:

- A bullish wave took over the market on the 2nd of August, and higher highs have been recorded throughout the successive trading sessions, since then. The rate of rise increased markedly after breaking through the $3,000 price level, which was bitcoin’s all time high that was recorded on the 11st of June. This reflects the depth of buy orders within the order book beyond this critical price level.
- We will plot a Fibonacci retracement that extends between the low recorded on the 16th of July ($1.825.5) and the high recorded earlier today ($3,420.7) to determine key support levels that will be the target reversal points of potential downwards price correction attempts. So, as shown on the above chart, we can expect bitcoin price to drop down to $2,967.8, which coincides with the 23.6% Fib retracement, if downwards price correction takes over before heading North to even higher price levels.
- Right now, the market is extremely bullish as shown by the alignment of the SMAs of Williams Alligator indicator. As you may notice, the green SMA is on top, the red SMA is in the middle and the blue SMA is on the bottom. Also, the three SMAs exhibit a steep upwards slope which reflects the strength of the bullish wave. Moreover, the MACD indicator is exhibiting a powerful bullish signal, as it values around 122 at the moment and the blue positive trend line is above the red negative trend line and both of them are sloping in an upwards direction. Accordingly, we can expect bitcoin price to continue rising towards the $3,800 price level within the upcoming week, yet as we mentioned earlier, a downwards price correction attempt can take over for a while, as speculators and traders close their long positions to collect their profits.
Conclusion:
Bitcoin price skyrocketed earlier today to exceed the $3,300 mark for the first time ever since the genesis block was mined. Our technical analysis is in favor of continuation of the current bullish wave, so we can see bitcoin price reach the $3,800 price level within a week or so; however, a downwards price correction attempt can take over for a short period, before heading North to even higher levels.
Chart from Bitfinex, hosted on Tradingview.com


