Bitcoin price surged last week to record a week high of $4,470, after testing the 23.6% Fibonacci retracement, as we expected during last week’s bitcoin price analysis. After dropping down to $3,607, the downtrend was reversed and bitcoin price started rising, recording the week’s high last Friday, which is $30 short of $4,500 which has been a major resistance preventing further price advancement , since the beginning of August.
So, where would bitcoin price be heading during the upcoming week?
Completing a 5 Wave Elliott Formation On the 4 Hour BTCUSD Chart:
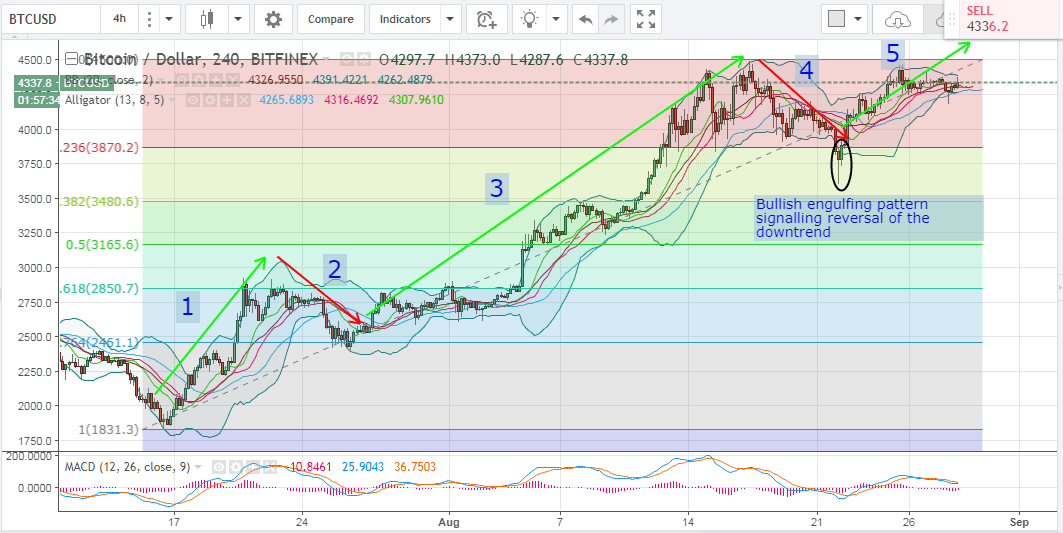
Let’s examine the 4 hour BTCUSD chart from Bitfinex, while keeping the Fibonacci retracement we plotted during last week’s analysis and plotting the Bollinger bands, Willams Alligator and MACD indicator (look at the below chart). We can note the following:

- Last week’s downtrend was reversed after overshooting below the 23.6% Fib retracement level, recording a low of $3,607. Even though bitcoin price dropped for around $263 below this crucial support level, price rose above it during the next trading session and a “bullish engulfing” pattern was formed signaling reversal of the downtrend. Also, the long downwards shadow of the candlestick near this level (look at the 2 candlesticks highlighted by an ellipse on the above chart) denotes the strong support around this level.
- A 5 wave Elliott formation has been forming on the 4 hour BTCUSD chart since the latter half of July, as shown on the above chart. Reversal of the downtrend last week signaled the start of the 5th wave, which is expected to take bitcoin price to record a high higher than the high recorded at the climax of the 3rd wave, so we expect to see bitcoin price exceed $4,500 within the next 1-2 weeks.
- The candlesticks are now moving close to the middle Bollinger Band, so bitcoin is not overbought yet, so chances are good that we can see it head North towards the $5000 price mark within a month or so. This is also supported by Williams Alligator SMAs, as they have just realigned themselves to exhibit a bullish signal. Also, the MACD indicator is in the positive territory, yet the negative red trend line is on top of the positive blue trend line. This alignment has to reverse before we can see an intense bullish wave.
Conclusion:
Bitcoin price recorded a high of $4,470 last week, before the market’s bears took the upper hand pullng price down to $4,335. A 5 Elliott wave formation can be spotted forming on the 4 hour BTCUSD chart, and as the 5th wave has just began to form, we expect bitcoin price to exceed $4,500 during the upcoming 1-2 weeks.
Chart from Bitfinex, hosted on Tradingview.com


