After recording a high of around $2693 yesterday, bitcoin price started dropping to a low of $2136. Throughout the past ten days, bitcoin price has been recording higher highs on most days which reflects the strength of the bullish wave that has been controlling the market since late March; however, this bullish wave seems to have been reversed yesterday as bitcoin price lost more than $450 of its value during less than 12 hours.
Reversal of May’s Bullish Run Evident on 1 Day BTCUSD Chart:
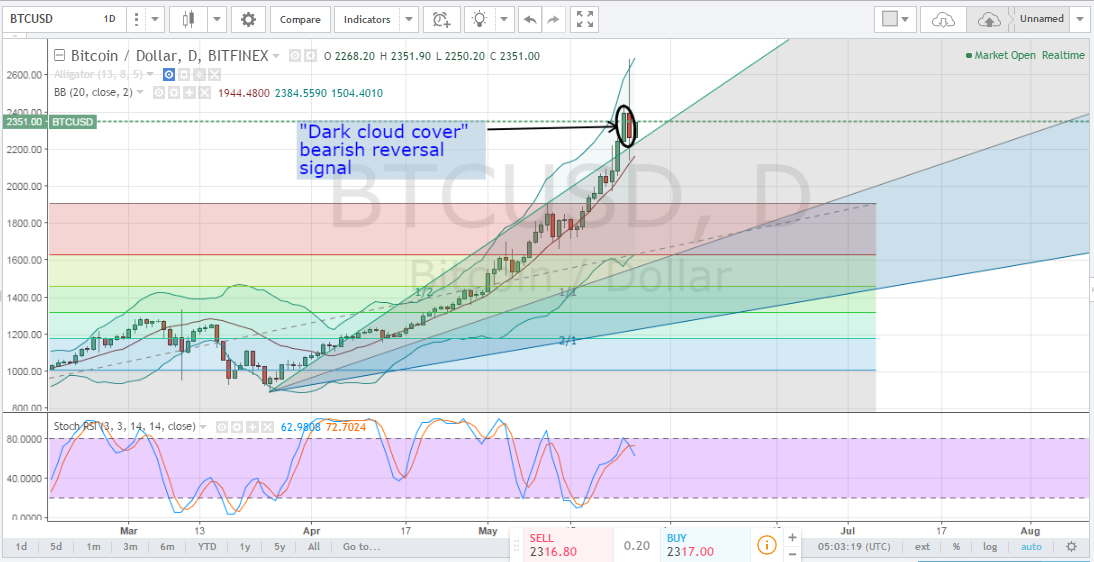
Let’s take a look at the 1 Day BTCUSD chart from Bitfinex, while keeping the Gann Angle placement and Fibonacci retracement we plotted during our latest weekly bitcoin analysis, plotting the Bollinger Band indicator and executing the Stochastic RSI oscillator (look at the below chart), we can notice the following:

- After recording another historical high yesterday at $2693, bitcoin price started falling to close on a price lower than the day’s opening price, after closing on higher highs everyday for the past 3 trading sessions. Yesterday’s candlestick led to the formation of a “dark cloud cover“, which is a bearish reversal signal formed by a bullish candlestick followed by a bearish candlestick that reaches a price level higher than that of the previous session and then closes below the midpoint of the body of the first bullish candlestick (look at the two candlesticks highlighted by an ellipse on the above chart). If today’s trading session closes on a price lower than that of yesterday’s, the dark cloud cover signal would be more significant denoting confirmation of reversal of May’s bullish run.
- Market instability was evident yesterday when price approached the $2600 level and started dropping after the candlestick’s upwards shadow touched the upper Bollinger band. Currently, the market is more stable as we are moving between the upper and middle Bollinger bands.
- The Stochastic RSI is literally the indicator of an indicator. It is an oscillator that is sensitive in detecting overbought and oversold market conditions. Yesterday, the Stochastic RSI valued 80 (>70) which reflected that bitcoin was overbought then and as price started dropping, the osciallator’s value also dropped to 71. At values > 70, the market is considered overbought, so we can expect bitcoin price to continue on dropping.
Conclusion:
Even though bitcoin price recorded yesterday a new historical high at $2693, it started falling afterwards to record a day low of $2136. Analysis of the charts shows that May’s bullish run is about to be reversed, so we can see a downwards price correction wave during the next few days, as traders sell their coins to collect their profits. As bitcoin price gained around $1500 during the past month, we can see downwards correction attempts take price down all the way to $1620 which represents around 50% of the profit gains during the past month.
Chart from Bitfinex, hosted on Tradingview.com


